PIs: Philip Orton, Alan Blumberg, Peter Rowe (New Jersey Sea Grant Consortium), Tanya Marione-Stanton (Jersey City Department of City Planning); Partners: Sergey Vinogradov, Naomi Hsu, Steve Eberbach, Jeff Wenger
Funding agency: NOAA Sea Grant
Project period: July 2013 – January 2015 (completed)

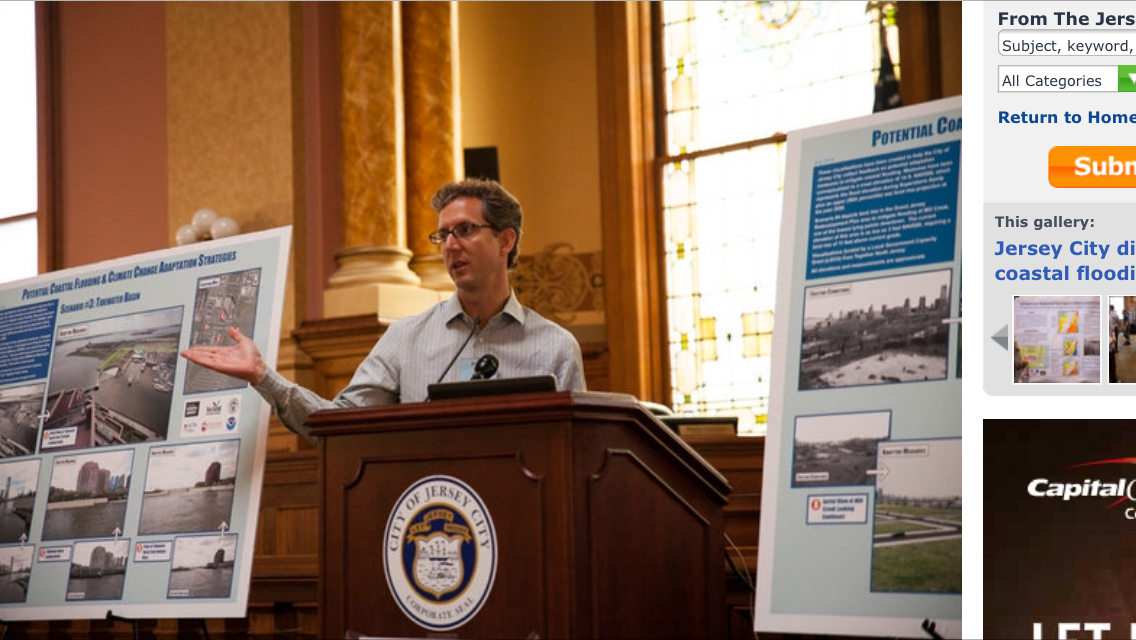
Photograph of Philip Orton presenting at City Hall, at one of the public meetings where Jersey City Planners and Stevens Researchers presented options for reducing the chances of storm surge flooding.
Coastal cities across the country are weighing their options for adapting to rising floods, yet there is limited quantitative information available to help make these decisions. This project was a collaboration between coastal flooding scientists and Jersey City planners to develop and test several options for adapting the region’s urban coasts to flooding and sea level rise. Jersey City (JC) is the second-most populous city in NJ, yet has 43% of its land within the new FEMA 100-year flood zones. We leveraged pre-existing storm surge modeling and flood zone mapping to quantify the performance of a set of storm surge protection measures for Jersey City.
Outcomes and outputs from the research included: (1) regional flood zone maps that account for future sea level rise and storm climatology changes, (2) model-based map animations of how floodwaters enter JC to help understand how the pathways can be blocked, (3) a report of a collaboratively determined set of coastal adaptation options, and their performance with sea level rise, (4) an outreach workshop where we presented the project’s results to additional regional stakeholders, and (5) a transferable, peer reviewed and published adaptation planning and evaluation framework. Lastly, and still an ongoing process, it is our goal to help Jersey City, and possibly additional area cities, to implement climate change planning policies to adapt to coastal flooding.
This framework can also be utilized for many other U.S. coastal regions – anywhere that hydrodynamic models are already being used to simulate storm surges or map flood zones. FEMA has embarked on an ambitious effort to re-evaluate the nation’s coastal flood zone maps, and many of these regional efforts are utilizing these models. Many areas also have storm surge forecast models in place that can be similarly used for adaptation studies.
Project Results Summary
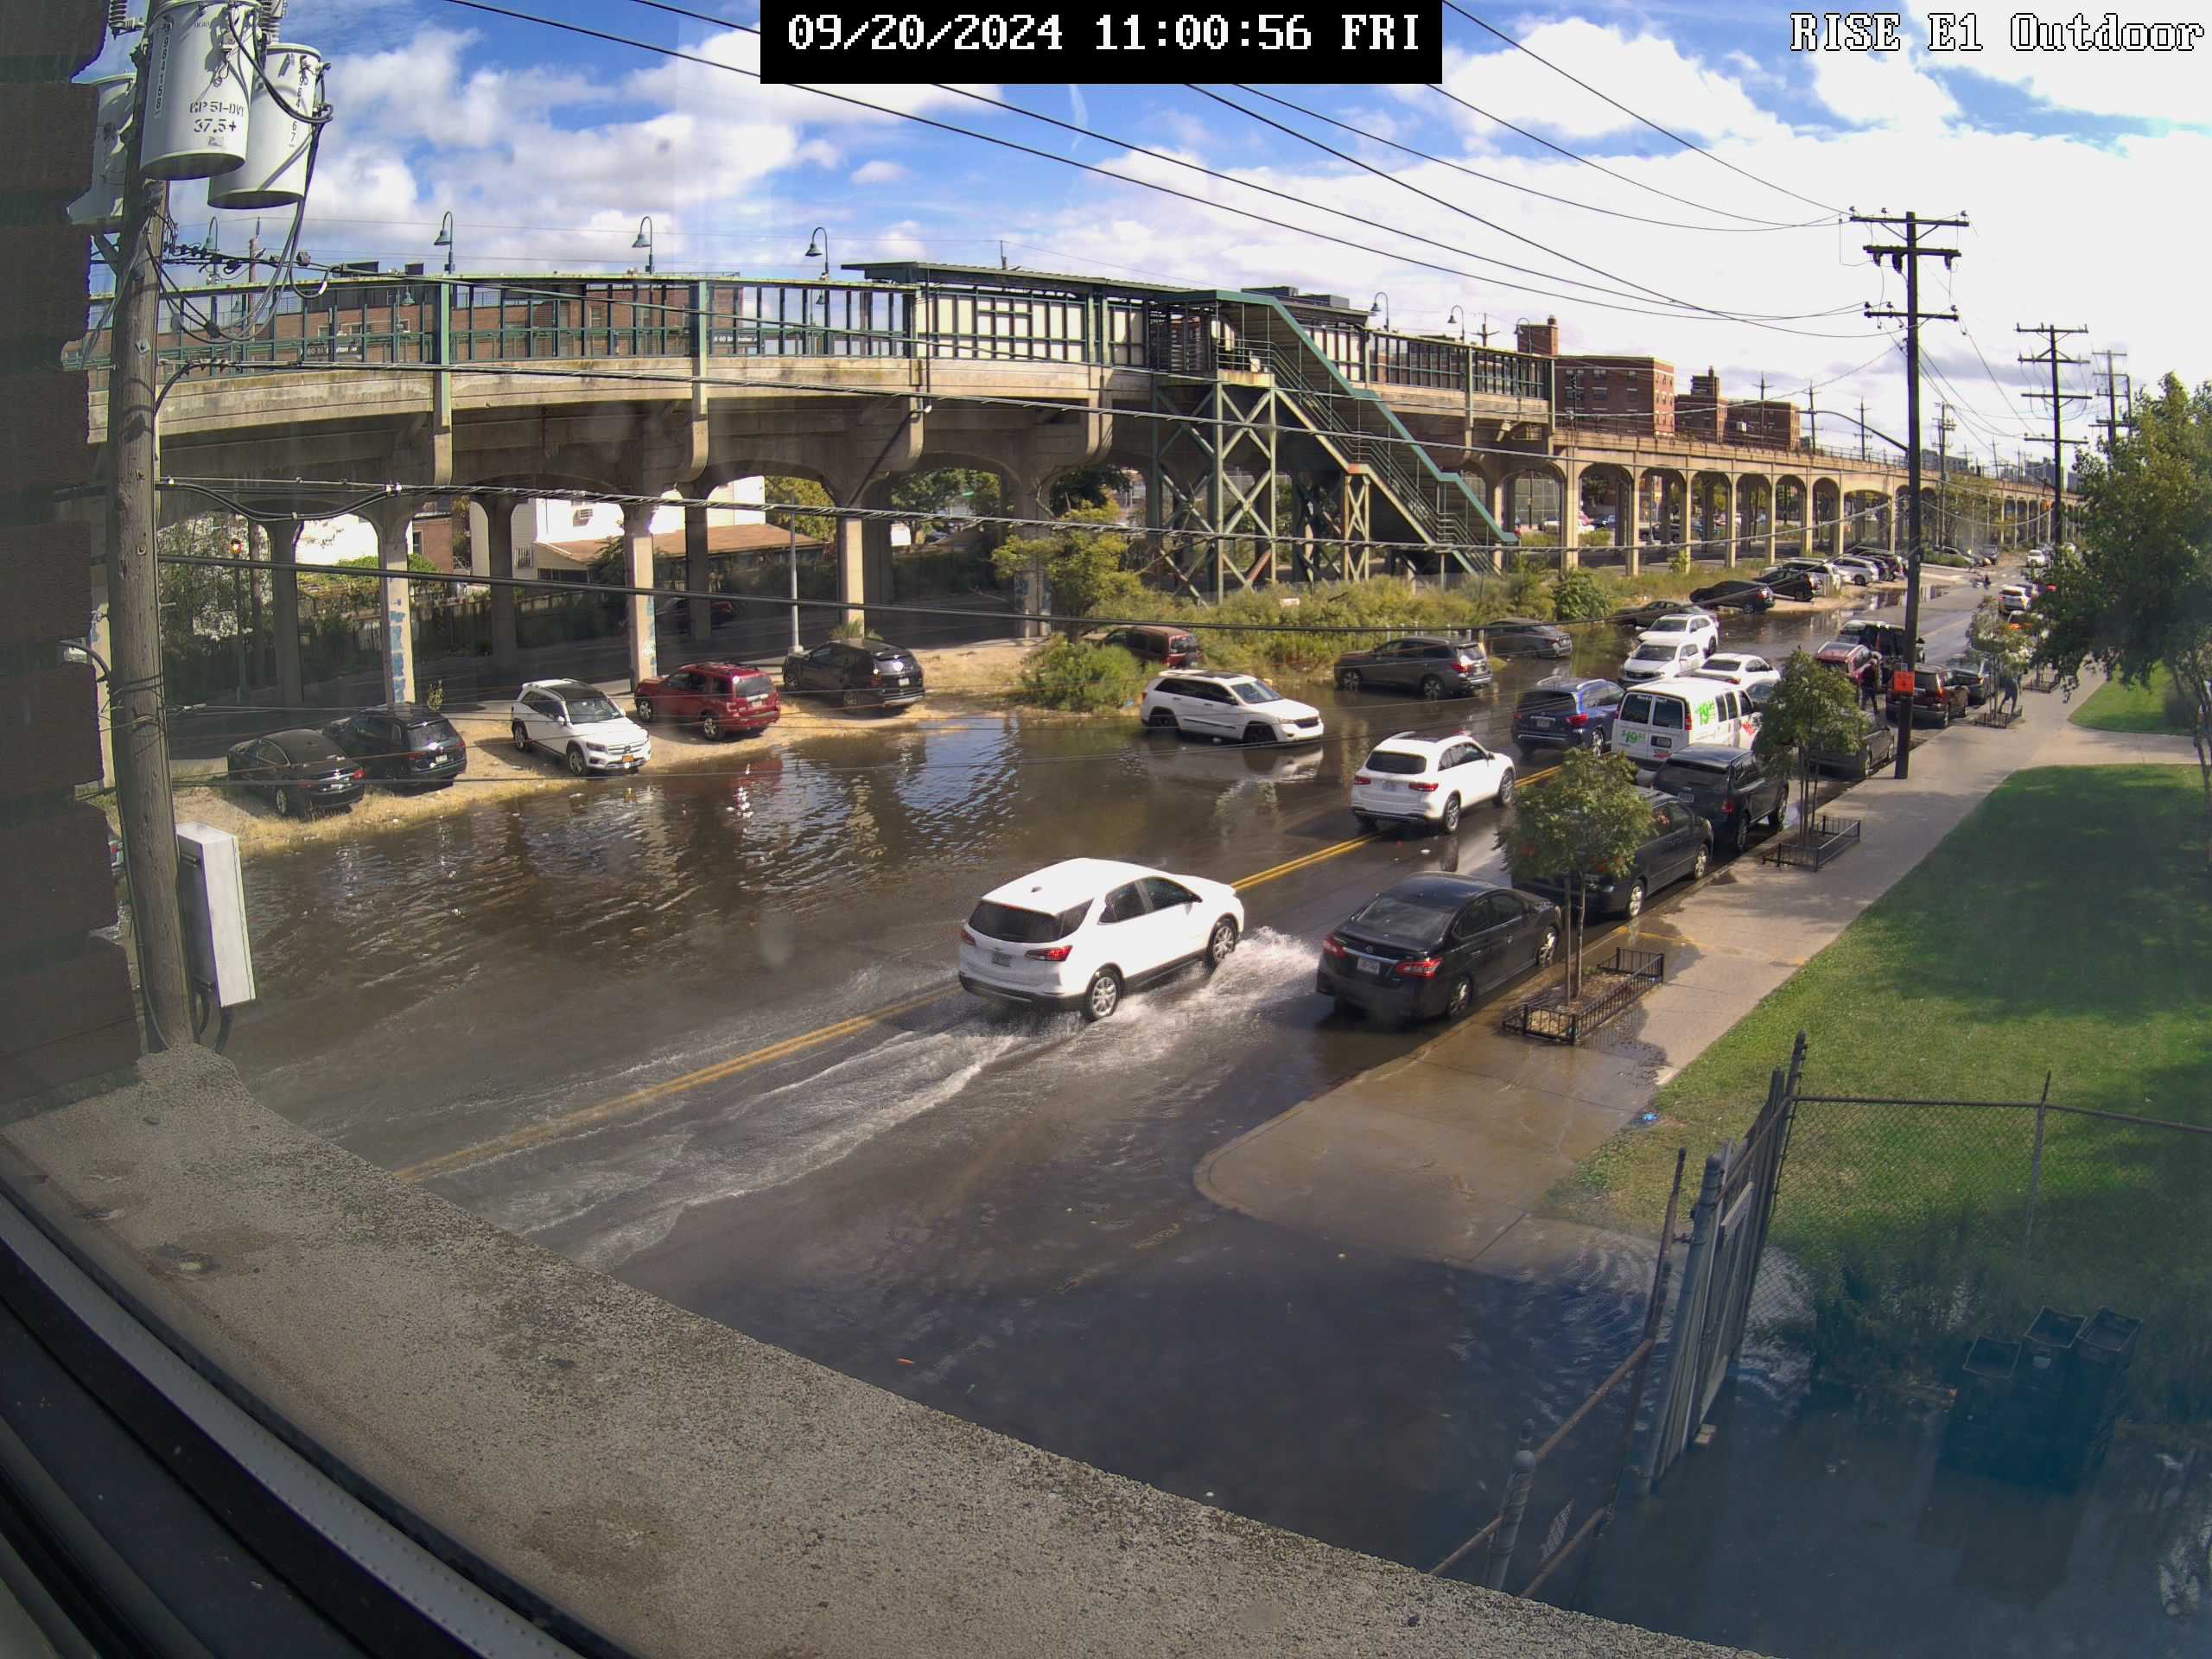
Computer storm surge simulations were used to map the effect of projected sea level rise on 100-year flood zones and to show the water pathways that flooded Jersey City during Hurricane Sandy, all useful information for planning measures that can prevent flooding.

Street-valley resolving animation of modeled Hurricane Sandy flooding entering downtown Jersey City (Blumberg et al. submitted). Color shading indicates floodwater depths over ground (legend on bottom right).
In several collaborative meetings, a broad set of realistic coastal protection measures and broad strategies were developed. Here is one example, a surge barrier that helps block a storm surge but could also be closed at low tide to create a rainwater basin for helping reduce the more frequent problem of rainfall flooding at high tide.
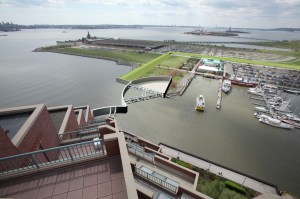
Illustration of one of 27 flood protection components, a surge barrier at Morris Canal Basin (aka Tidewater Basin), south of downtown Jersey City
This image comes from a partner project by Michael Baker Jr. Inc, and the report for that project is available here and includes both visualizations of the adaptation strategies, as well as a scoping study of what would be needed to conduct a benefit-cost analysis for the plans.
The storm surge modeling was then used to evaluate the efficacy of each adaptation measure, as well as how sea level rise and climate change will affect performance. A city-wide adaptation scenario that combines several of the individual adaptation measures is found to protect most areas of the city from all storm events tested, ranging from a severe nor’easter that occurred in 1992, to Hurricane Sandy plus 31” of sea level rise (a high-end projection for 2055).
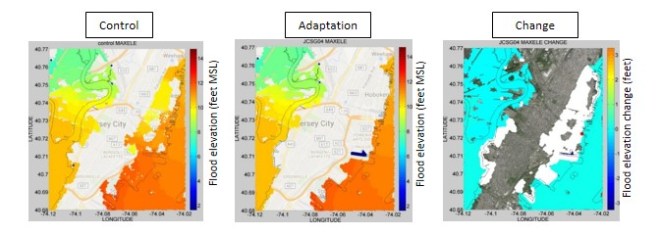
Flood elevation model results for Hurricane Sandy Control (left), the full adaptation scenario (center), and the difference. In the right‐side panel, white areas have flooding in the control run, and do not have flooding with the adaptation scenario (flooding is prevented).
Hurricanes of a higher flood level than Sandy are possible, though unlikely – based on our replication of the FEMA flood mapping study (with added sea level rise), the 14-foot protection elevation could be overtopped by storms today, with an annual probability of 0.3%, or by storms after 31” of sea level rise, with an annual probability of 1%. A partial adaptation plan of land elevation increases around planned projects leads to prevention of flooding for most neighborhoods for the #2 and #3 largest flood events of the past century, the 1992 nor’easter and Hurricane Donna, but does not provide protection against Hurricane Sandy, and only keeps certain neighborhoods dry for the other flood events (e.g. Donna) when we consider 31” of sea level rise.
Read the full report here.