Tag Archives: adaptation

Compound Fluvial-Coastal Flood Adaptation

PI Philip Orton, Stevens Institute of Technology

Co-PI Franco Montalto, Drexel University 

Co-PI Marc Cammarata, Philadelphia Water Department 

Additional team members: Julia Rockwell (PWD), Korin Tangtrakul (Drexel), Kazi Mita (Stevens)

Funding agency/program:  National Oceanic and Atmospheric Administration, Climate Program Office, Coastal Ocean Climate Applications (COCA)/Sectoral Applications Research Program (SARP)

Project Period:  September 2019 to August 2023

Abstract

Compound flooding is the combination of rainfall-induced flooding with storm surge induced flooding, and is currently inadequately considered nationwide in both flood risk assessment and forecasts. It is well-established that coastal floods are becoming more frequent, and the U.S. Northeast has seen a substantial increase in intense rainfall events in recent decades, likely as a result of climate change. In many U.S. cities, coastal and fluvial floods merge in estuaries, causing a compounded problem, and the coincident occurrence of extreme rain and surge is growing at many locations. However, little research has been performed to improve our understanding of compound flooding.

An ideal location to investigate this problem, Eastwick is a low-lying neighborhood in South Philadelphia situated near the Delaware River at the confluence of Darby and Cobb’s Creeks. It is in close proximity to the 1.2 km2 John Heinz National Wildlife Refuge, two federal Superfund sites, a series of oil refineries, and the Philadelphia International Airport, and meets the EPA criteria for an Environmental Justice community, with a majority (76%) of its population being African American, and pockets of low income residents. Triggered by rainfall, coastal surges pushing up the tidal portion of the Delaware River, or some combination of the two, flooding has long been one of the biggest problems facing this community.

The proposed research will inform climate risk management and adaptation decision-making regarding flooding in Eastwick, and will be performed by researchers from two universities and the Philadelphia Water Department (PWD). The project will include four core areas of science, as well as a community engagement process, strong coordination with decision makers and a specific focus on two ongoing city planning initiatives. The core compound flood science research areas include flood modeling, extreme value analysis, climate-impact assessment, and adaptation benefit-cost analysis. The engagement process will consist of two community workshops, including collaborative design of flood adaptation scenarios and a socially-sourced validation of the flood modeling. Coordination with decision makers will occur through an advisory panel, project webinars, and the activities of our team members at the PWD.

The proposed research will strongly further NOAA and COCA/SARP interests relating to climate change. It presents a framework and detailed technical approach for addressing both the communication of risk and the economics of adaptation to compound flooding and climate change. An important additional component of the planned research is to compare our detailed analyses to simplified approaches, to improve the transferability of the work to other communities with similar challenges. The advancement of scientific understanding, prediction and communication of compound flooding will help enable effective decisions, and our development and dissemination of modeling, statistical hazard analysis and benefit-cost analysis tools will have a nationwide impact on resilience.

Project data available

Kazi, Mita (2022), “Eastwick Compound Flood Model”, Mendeley Data, V1, doi: 10.17632/3wjvmymf68.1

Introduction

Eastwick is a low-lying community in South Philadelphia that floods frequently yet lacks sufficient information on flood risk or adaptation. It meets the EPA criteria for an Environmental Justice community, with a majority (76%) of its population being African American, and pockets of low income residents. The community is situated near the Delaware River at the confluence of Darby and Cobb’s Creeks, and in close proximity to the 1.2 km2 John Heinz National Wildlife Refuge. Unfortunately, Eastwick also happens to be located next to portions of the Lower Darby Creek Superfund Site, increasing the health risks posed by any flooding that occurs in this area.

Flooding has long been one of the biggest problems facing Eastwick, the lowest-lying community in Philadelphia (University of Pennsylvania, 2017). Eastwick’s floods can be purely due to rainfall, purely due to high coastal sea levels pushing up the tidal Delaware River, or they can be compound flooding (Moftakhari et al., 2017; Wahl et al., 2015), the merger of the two (U.S. Army Corps of Engineers, 2014).  As such, the community exemplifies a common problem faced by low-lying coastal neighborhoods located at the downstream end of coastal urbanized watersheds found across the nation. Eastwick has been designated by FEMA as a Special Flood Hazard Area. In 1999, for example, Hurricane Floyd deposited 25 cm of rain in the Darby Creek watershed and pushed a 0.85 m surge up the Delaware River, creating such severe flooding that residents had to be rescued by rowboat.  After Hurricane Irene’s (runoff-induced) flood and just before Hurricane Sandy’s (surge-induced) flood, the Mayor called for a comprehensive solution to Eastwick’s flooding problems, yet to date no comprehensive mitigation plan for the neighborhood has been developed.

Compound flooding is currently inadequately considered nationwide in both flood risk assessment and modeling activities. Neither FEMA’s maps, nor NOAA’s forecasts address compound flooding because they address runoff-induced or surge-derived flooding separately (e.g., Corelogic, 2017a; Moftakhari et al., 2017; Orton et al., 2012). For example, Philadelphia is ranked as being the metro area with the 11th-highest hurricane storm surge risk in the US (Corelogic, 2017b), but that study did not account for rainfall. Flood modelers often either assume constant stream flow, if they are simulating surge-derived floods, or a static coastal water level if they are simulating runoff-induced riverine floods (e.g., U.S. Army Corps of Engineers, 2014). Holistic simulation and probabilistic assessment of compound flooding is thus essential to “risk characterization” and to “the development of innovative, applicable, and transferable approaches for decision making” in urban coastal communities across the nation (two key goals of the CSI program).

Proposed study and objectives

The overriding objective of the proposed research is to inform climate risk management and decision-making regarding flooding in Eastwick. The proposed research activities will be integrated into two ongoing community planning initiatives: (1) the City-wide Flood Risk Management Task Force which was first convened in 2015 “to address the circumstances of flooding as it impacts various Philadelphia neighborhoods” including Eastwick (PWD, 2017a) and (2) the Lower Eastwick Public Land Strategy (LEPLS), a planning effort that has developed and will now begin to implement a vision for Eastwick’s vacant and publicly-owned land (RDA, 2017). Our interactions with the Task Force will be facilitated principally by project partner Philadelphia Water Department (PWD) with Co-PI Joanne Dahme and PWD project manager Julia Rockwell, while our interaction with the LEPLS (Figure 1) will be through our partners at Keystone Conservation Trust and the Eastwick Friends and Neighbors Coalition.

Flow Chart 3a

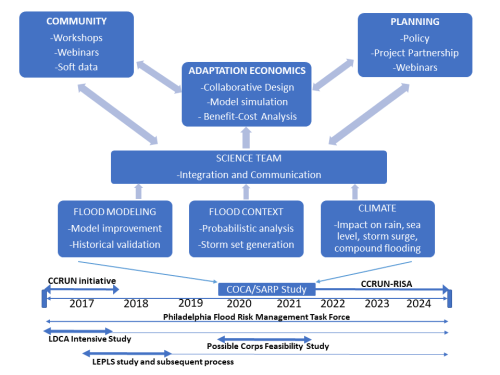
Figure 1:  Diagram of the proposed COCA/SARP project (top) as well as the timeline of projects with which the study would connect or leverage (bottom).

The research team will improve an existing dynamic model of compound flooding in Eastwick developed by the project team and use it in conjunction with ongoing and proposed new stakeholder activities in several inter-related ways. The land use strategies developed by the LEPLS team will be incorporated into the model domain, ensuring that future climate impacts and adaptation scenarios respond to the community’s expressed aspirations and goals regarding local land cover and land use. New workshops planned by the project team will be used to validate retrospective model simulations with local knowledge regarding the location, timing and severity of historical flooding in the community (a “social validation”).  These workshops will also source community-guided green and grey flood adaptation measures across the watersheds and waterfronts (e.g. Figure 2). The efficacy of these measures for mitigating flooding will be quantified with dynamic flood modeling of historical and synthetic flood events across a wide range of return periods (e.g. Figure 3). Damage computations for flooding and benefit-cost ratios will be computed using improved city data within FEMA’s HAZUS software.

eastwick_workshop_pic

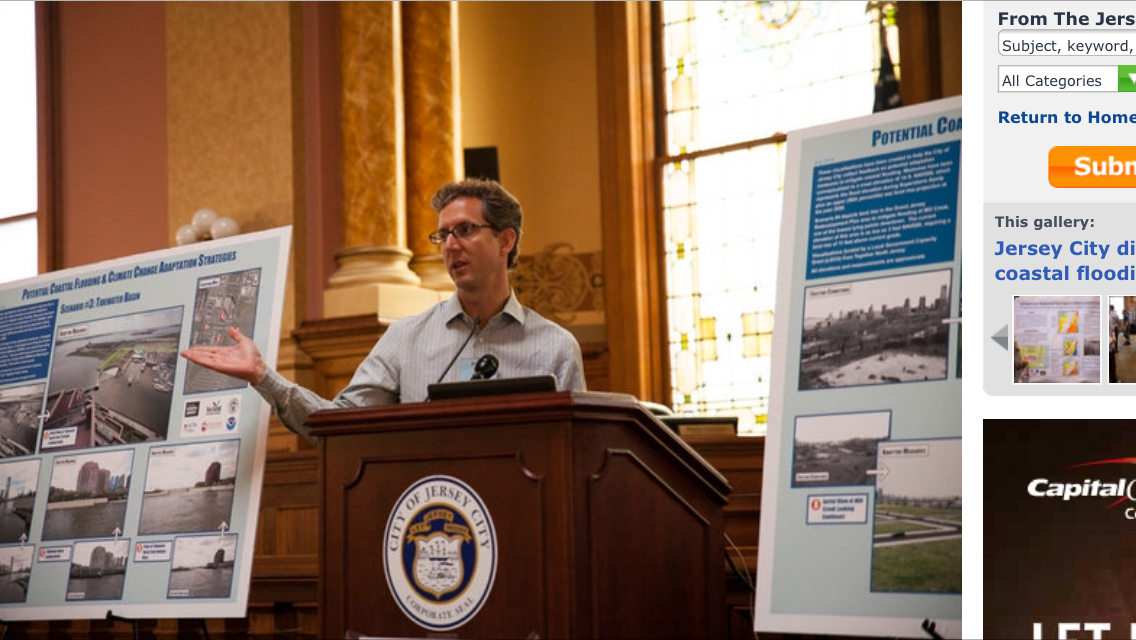
Figure 2:  Co-PI Montalto and his students listening to community leaders with Eastwick Friends and Neighbors Coalition (EFNC) at last year’s flooding workshop.

These activities will be coordinated through and at times conducted during regularly scheduled meetings of the City-wide Task Force, minimizing the time commitment that our engagement activities will have on local stakeholders, while also ensuring participation of a diverse and representative group of intended beneficiaries in the research. This synchronization will ensure that the research outputs are both timely and germane, given other planned activities in this dynamic community.

In this way, we will test innovative, broadly applicable approaches for flood modeling, flood risk assessment, benefit-cost analysis of compound flood risk reduction scenarios. Key contributions of the research to the science of climate adaptation and engagement will be: a) an evaluation of the proposed stakeholder-engaged modeling approach as a means of communicating complex probabilistic, multi-source flood risks to a vulnerable community, b) development of a workshop framework that can be used to explore the advantages and disadvantages of alternative adaptation strategies under a wide range of compound flood risk scenarios.

sandrene

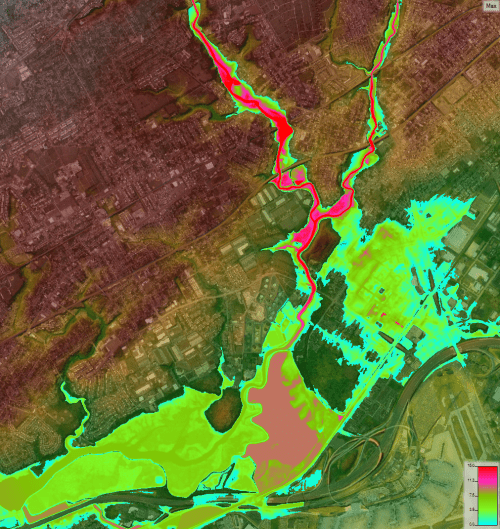
Figure 3: Example of modeled flooding (shaded water depth in feet) for a synthetic storm event with Hurricane Sandy’s Delaware River water levels combined with Hurricane Irene’s Cobbs-Darby streamflows.  Eastwick spans the top-right to the center-right.

References

Corelogic. (2017a). Storm Surge Inundation vs Freshwater Flooding Report.   Retrieved August 8, 2017, from http://www.corelogic.com/about-us/researchtrends/storm-surge-inundation-vs.-freshwater-flooding-report.aspx?WT.mc_id=crlg_170601_97ewN#.WYt9kVF95PY

Corelogic. (2017b). Storm Surge Risk Report.   Retrieved August 9, 2017, from http://www.corelogic.com/about-us/researchtrends/storm-surge-report.aspx?WT.mc_id=pbw_170530_iRNG1

Moftakhari, H. R., Salvadori, G., AghaKouchak, A., Sanders, B. F., & Matthew, R. A. (2017). Compounding effects of sea level rise and fluvial flooding. Proceedings of the National Academy of Sciences, 114(37), 9785-9790.

Orton, P., Georgas, N., Blumberg, A., & Pullen, J. (2012). Detailed modeling of recent severe storm tides in estuaries of the New York City region. Journal of Geophysical Research, 117, C09030. doi: 10.1029/2012JC008220

PWD. (2017a). Citywide Flood Risk Management Task Force.   Retrieved August 9, 2017, from http://www.phillywatersheds.org/category/blog-tags/citywide-flood-risk-managment-task-force

University of Pennsylvania. (2017). Researchers and Residents Explore ways Eastwick Floods and Ideas for Mitigation.   Retrieved May 19, 2017, from https://www.sas.upenn.edu/urban/news-events/news/researchers-and-residents-explore-ways-eastwick-floods-and-ideas-mitigation

U.S. Army Corps of Engineers. (2014). Eastwick Stream Modeling and Technical Evaluation Philadelphia, Pennsylvania, Philadelphia District, North Atlantic Division.

Wahl, T., Jain, S., Bender, J., Meyers, S. D., & Luther, M. E. (2015). Increasing risk of compound flooding from storm surge and rainfall for major US cities. Nature Climate Change, 5(12), 1093-1097.

Leave a comment

Filed under ongoing projects

Quantifying the Value and Communicating the Protective Services of Nature-Based Flood Adaptation

PIs:  Alan Blumberg, Philip Orton, Eric Sanderson (Wildlife Conservation Society), Mark Becker (Columbia CIESIN; 1961-2014), Kytt MacManus (Columbia CIESIN)

Funding agency:  NOAA Coastal and Ocean Climate Applications (COCA)

Project period:  January 2014 – May 2016

Summary

This project has ended, and has a new webpage summarizing its results: http://AdaptMap.info

Wetlands are frequently mentioned by city planners and the general public for their protective benefits against storm surges.  Unfortunately, these important ecosystems are still disappearing in spite of this qualitative knowledge of their benefits.  Municipalities across the nation are weighing the value of coastal wetlands for flood protection and the many ecosystem services they provide, yet there is limited quantitative information available to help make these decisions.

We are conducting a study of historic and potential future green shorelines in Jamaica Bay, New York City.  The primary output of the study is a “next-generation” sea level rise viewer that demonstrates the dynamically modeled effects of green shorelines on flood hazard zones.  The tool also provides information on damages from flooding as well as cost-benefit analyses for green shoreline adaptations for the bay.  The landscape of Jamaica Bay in prior centuries is also being mapped and floods modeled, to learn more about the resilience of past shorelines.  A set of three future living shoreline adaptation scenarios is being collaboratively developed in a workshop with city planners, resource managers, and our science team.

Introduction

Coastal storms are among the world’s most costly and deadly disasters, with strong winds, floodwater inundation, and coastal erosion capable of damaging and disabling infrastructure. Increased damage from storm surge flooding is one of the most certain impacts of climate change, with the potential for intensified storms, increased rainfall, and with storm surges coming on top of rising sea levels. Sea level rise is expected to accelerate over the 21st Century, primarily due to increasing expansion of warming seawater and accelerated melting of land-based ice sheets. A conservative estimate of 30-60cm for New York City (NYC) by 2080 will change a 100-year flood event to a 30-year flood event, and “rapid ice-melt” scenarios call for over a meter of sea level rise over this period [Horton et al. 2010].

Hundreds of thousands of NYC residents in Jamaica Bay’s watershed live on land within range of a 5 m hurricane storm tide (Figure 1), and Hurricane Sandy (3.5 m above mean sea level) flooded some of these neighborhoods. Hurricanes made direct hits on NYC four times over the last 400 years including 1693, 1788, 1821, and 1893 and will likely do so again [Scileppi and Donnelly, 2007]. Moreover, sea level rise of 1 m will mean that a severe extra-tropical storm (a “nor’easter”) will lead to flooding levels nearly as bad as Sandy or the historic hurricanes – the worst nor’easters (e.g. 1992) have an annual probability of occurrence of one in twenty and cause maximum water levels of about 2.0-2.5 m [Orton et al. 2012].

Figure 1:  NYC map showing population and density in low-elevation coastal zones (LECZ) below 5 m above mean sea level (Columbia CIESIN; http://sedac.ciesin.columbia.edu/gpw/ lecz.jsp). Hurricane Sandy’s flooding was extensive in neighborhoods surrounding Jamaica Bay.

Figure 1: NYC map showing population and density in low-elevation coastal zones (LECZ) below 5 m above mean sea level (Columbia CIESIN; http://sedac.ciesin.columbia.edu/gpw/lecz.jsp). Hurricane Sandy’s flooding was extensive in neighborhoods surrounding Jamaica Bay.

In past centuries, a large expanse of tidal wetlands, oyster beds, riparian systems, barrier beaches, and shallow water depths in and around Jamaica Bay likely helped shield Southeast Brooklyn and South Queens from storm surge flooding. Today those wetlands are depleted, the oysters gone, the riparian systems and barrier beaches partially paved over, and the depths of Jamaica Bay altered by dredging and land fill. A successful experimental Corps of Engineers program that has rebuilt a small portion of the tidal wetland islands in Jamaica Bay from 2009-2012 raises the possibility that these losses can be reversed, but the cost of rebuilding the losses from 1974-1999 alone has been estimated to be $310 million at ~$500,000/acre [S. Zahn, NY State Department of Environmental Conservation, pers. comm, 2012].

Nationwide, living shorelines of many types are still disappearing, in spite of society’s qualitative knowledge of their benefits. In recent decades, the decline of tidal wetlands has continued [Dahl, 2006]. Much like wetlands, shellfish reefs also can provide protective benefits from storm-driven waves and flooding, due to their rough surfaces and added frictional effect on rapidly moving waters. Unfortunately, wild oyster biomass in U.S. estuaries has declined by 88 percent over the past century [Zu Ermgassen et al. 2012]. These changes are likely only partially a result of sea level rise – both wetlands and shellfish reefs are to a varying extent ecosystem engineers and can grow upward with sea level rise, though the maximum rates at which they can rise are uncertain. Other issues that continue to wipe out wetlands include eutrophication due to excessive nutrient inputs [Deegan et al. 2012], a particularly difficult problem to solve in urban estuaries, typically requiring billions of dollars in grey infrastructure [e.g., NYC-DEP, 2010; Taylor, 2010].

Quantifying the economic values of these protective services for socioeconomic analyses is a crucial step for conserving these beneficial coastal ecosystems [NRC, 2005]. NYC and many other municipalities across the nation are weighing restoration or protection of living shoreline ecosystems, yet there is limited quantitative information available to help make these decisions. An old rule of thumb holds that 14.5 km of wetlands reduces a storm surge by 1 meter, though this is based on an observational study of historical Louisiana hurricanes that actually showed variations of over a factor of three in the surge reductions [USACE, 1963]. More recent research has shown that the attenuation of storm surge by marshes actually varies even more than a factor of three, and wetlands sometimes do not attenuate storm surges at all. The attenuation by wetlands depends on many details including direction and duration of the storm’s winds and waves, and the coastal topography and bathymetry around the wetlands [Resio and Westerink, 2008]. It is becoming accepted that the protective benefits are larger for storms with winds that blow onshore only for a short duration [Gedan et al., 2010; Resio and Westerink, 2008]. This is an important factor for the NYC region, because historical hurricanes making landfall in this region have moved rapidly at speeds of 45-110 km h-1 [Orton et al. 2012], often passing in only a matter of hours, so coastal wetlands may have more protective potential than in other places where hurricanes often move more slowly.

A key opportunity exists to leverage existing model-based flood zone mapping and risk assessment work, and use them to help quantify the value of living shorelines and map their flood protection services. The Federal Emergency Management Agency (FEMA) has embarked on an ambitious effort to re-evaluate the nation’s coastal flood hazard for the purpose of updating all the coastal flood zone maps. Many of these regional efforts are utilizing hydrodynamic modeling of storm surges, and FEMA is amassing and producing detailed and publically-available datasets for areas such as New York, New Jersey, Delaware Bay and Philadelphia, Mississippi, South Carolina, West Florida, and Florida’s Big Bend. Using hydrodynamic models and accounting for simple frictional influences of land-cover data, it is possible to use these data with storm surge models to quantify the influence of coastal wetlands and shellfish on the particularly sensitive and expensive issue of flooding.

Here, research is proposed with an overriding goal of developing methods to quantify the economic value and communicate the protective services of living shorelines across the United States. The primary scientific objectives include:

  • Map the extent of Jamaica Bay wetlands, beaches, mud flats, and other ecosystem features and the bathymetric depth profile for the late 1800s and modern-day periods
  • Quantify the flood resilience of historical versus present-day coastal zone using model runs of the Stevens Estuarine and Coastal Ocean Model (sECOM) that is used within the Stevens Storm Surge Warning System (http://stevens.edu/SSWS).
  • Work with decision-makers and natural resource managers to develop three realistic future living shoreline scenario options that can reduce storm surge flood elevations
  • Perform a cost-benefit analysis of future living shoreline landscape scenarios based on construction cost analyses and a full risk assessment for storm-driven flooding
  • Give both decision-makers and the general public an online tool that helps them obtain an improved, quantitative understanding of the role that living shorelines like wetlands and shellfish reefs can have on coastal flooding. The tool will enable users to explore future flood zones, and to select future living shoreline adaptation scenarios to view their influence on these flood zones.

A final report for the project is available on the AdaptMap webpage, or linked here:   http://adaptmap.info/jamaicabay/technical_report.pdf

References

Dahl, T. E. (2006), Status and trends of wetlands in the conterminous United States 1998 to 2004, 112 pp., Washington, D.C.

Deegan, L. A., D. S. Johnson, R. S. Warren, B. J. Peterson, J. W. Fleeger, S. Fagherazzi, and W. M. Wollheim (2012), Coastal eutrophication as a driver of salt marsh loss, Nature, 490(7420), 388-392.

DEP (2007), Jamaica Bay Watershed Protection Plan, Volume 1, edited, p. 128pp, New York City Department of Environmental Protection (DEP), New York.

Gedan, K. B., M. L. Kirwan, E. Wolanski, E. B. Barbier, and B. R. Silliman (2010), The present and future role of coastal wetland vegetation in protecting shorelines: answering recent challenges to the paradigm, Climatic Change, 1-23.

Horton, R., V. Gornitz, M. Bowman, and R. Blake (2010), Chapter 3: Climate observations and projections, Annals of the New York Academy of Sciences, 1196(1), 41-62, DOI: 10.1111/j.1749-6632.2009.05314.x.

NRC (2005), Valuing ecosystem services: Toward better environmental decision-making., National Academy Press, National Research Council, Washington, D.C.

NYC-DEP (2010), NYC Green Infrastructure Plan: A sustainable plan for clean waterways, 143 pp, New York City.

Orton, P., N. Georgas, A. Blumberg, and J. Pullen (2012), Detailed Modeling of Recent Severe Storm Tides in Estuaries of the New York City Region, J. Geophys. Res., 117, C09030, DOI: 10.1029/2012JC008220.

Resio, D. T., and J. J. Westerink (2008), Modeling the physics of storm surges, Physics Today, 61, 33.

Scileppi, E., and J. P. Donnelly (2007), Sedimentary evidence of hurricane strikes in western Long Island, New York, Geochemistry, Geophysics, Geosystems, 8(6), DOI: 10.1029/2006GC001463.

Taylor, D. I. (2010), The Boston Harbor Project, and large decreases in loadings of eutrophication-related materials to Boston Harbor, Marine pollution bulletin, 60(4), 609-619.

USACE (1963), Interim Survey Report, Morgan City, Louisiana and Vicinity, in serial no. 63, edited, U.S. Army Corps of Engineers District, New Orleans, LA.

Zu Ermgassen, P. S. E., et al. (2012), Historical ecology with real numbers: past and present extent and biomass of an imperilled estuarine habitat, Proceedings of the Royal Society B: Biological Sciences, 279(1742), 3393-3400.

1 Comment

Filed under ongoing projects

Coastal Adaptation Impacts on Water Quality and Flooding

Principal Investigators Philip Orton, Nickitas Georgas, Alan Blumberg, Stevens Institute of Technology; James Fitzpatrick, HDR, Inc.

Funding Agency:  Department of Interior, National Parks Service

Project Period:  November 2014 – October 2017 (Completed)


Primary Research Products

Fischbach, J., H. Smith, K. Fisher, P. Orton, E. Sanderson, R. Marsooli, H. Roberts, and others (2018), Integrated Analysis and Planning to Reduce Coastal Risk, Improve Water Quality, and Restore Ecosystems: Jamaica Bay, New York. Final project report for The Rockefeller Foundation.  web open access

Marsooli, R., P. M. Orton, J. Fitzpatrick, and H. Smith (2018), Residence time of a highly urbanized estuary: Jamaica Bay, New York, Journal of Marine Science and Engineering, 6(44), doi:10.3390/jmse6020044.   web open access

Marsooli, R., P. M. Orton, G. Mellor, N. Georgas, and A. F. Blumberg (2017), A Coupled Circulation-Wave Model for Numerical Simulation of Storm Tides and Waves, J. Atmos. Oceanic Technol.(2017), doi:http://dx.doi.org/10.1175/JTECH-D-17-0005.1.  web open access

Marsooli, R., P. M. Orton, and G. Mellor (2017), Modeling wave attenuation by salt marshes in Jamaica Bay, New York, using a new rapid wave model, Journal of Geophysical Research – Oceans, 122, doi:10.1002/2016JC012546.  PDF web

Marsooli, R., P. M. Orton, N. Georgas, and A. F. Blumberg (2016), Three-Dimensional Hydrodynamic Modeling of Coastal Flood Mitigation by Wetlands, Coast. Eng., 111, 83-94. web open access

  1. Summary

Hundreds of thousands of NYC residents in Jamaica Bay’s watershed live on land vulnerable to flooding from a hurricane storm tide. Many types of coastal protective features, ranging from surge barriers to natural features like wetlands and oyster beds, have been suggested as solutions for coastal flooding around the bay. Water quality and storm damage avoidance are integrally linked research topics, as storm protection efforts can harm water quality and alter ecosystems. A project is outlined here to improve upon existing mathematical computer modeling capabilities for Jamaica Bay and to run experiments to study climate change, sea level rise and coastal adaptation impacts on water quality and storm damages. An important part of the project plan is to build Jamaica Bay Science and Resilience Institute consortium technical capacity by making these models available for consortium member use.

View of New York City's skyline, over Jamaica Bay wetlands (credit: Jeanne Hillary)

View of New York City’s skyline, over Jamaica Bay wetlands

  1. Introduction

Hurricane Sandy was a painful reminder that coastal storms are among the world’s most costly and deadly disasters, capable of causing tens-to-hundreds of billions of dollars in damages and destroying entire neighborhoods. For New York City, hundreds of thousands of NYC residents live at low elevations (below 5 m) surrounding Jamaica Bay, a bay situated on the south-east edge of the city.

Jamaica Bay has an area of 107 km2, is ecologically rich, and has some of the largest remaining tidal wetlands in New York State. However, aerial photographs from 1974 to 1999 show that 2.5 km2 of marshes in the bay’s interior and nearly 80 percent of the interior islands vegetative cover disappeared over this period [Hartig et al., 2002]. The total loss of interior wetlands for the bay since the mid-1800s is estimated to be 12000 of the original 16000 acres [DEP, 2007], and the bay once supported a large oyster fishery producing 700,000 bushels of oysters per year in the early 1900s [Franz, 1982].

Many types of coastal protective features, ranging from surge barriers to natural features like wetlands and oyster beds, are being studied as solutions for coastal flooding. Decisions on which coastal protections to use require detailed studies using computer models that are not available or fully developed for most locations. These models must include many features in addition to physical storm surges, such as chemistry and water quality, to be able to evaluate whether water quality and ecosystems will be harmed by the protections.

Mathematical modeling is useful for understanding water circulation, waves, flooding, water quality, and ecosystem dynamics, among other topics.  Model experiments can reveal dynamics of each of these systems, within the constraints of a given model construct.  Modeling connects with observations, which are used for model development and validation, yet are also interpolated in time and space by the model, to provide a more complete picture a water body, such as Jamaica Bay.  As a result, modeling has major benefits for any comprehensive analysis of the bay, such as for quantification of flood damage reductions.  Modeling also connects with decision analysis, as it opens the door to experimentation to understand future changes due to climate change, sea level rise, and human alterations around and within the bay.

A project is outlined here to improve upon existing modeling capabilities for water quality, flooding and waves for Jamaica Bay, and to run experiments to study climate change, sea level rise and coastal adaptation impacts on water quality and storm damages. An important part of the plan is to build Jamaica Bay Science and Resilience Institute consortium technical capacity by making these models available for consortium member use at CUNY’s High Performance Computing Center (HPCC).

 The primary goals in the project will be to:

  • Improve the existing water quality modeling in Jamaica Bay (J-Bay) with enhanced model representations of wetlands, macro-algae, and wetland and benthic chemical/nutrient fluxes.
  • Improve hydrodynamic model representations of J-Bay wetlands and air-sea interaction
  • Utilize higher-resolution modeling in the bay and improve modeling of exchanges with the coastal ocean by coupling the J-Bay models with inputs from regional scale models
  • Calibrate the improved models using data collected by the consortium and USGS in J-Bay
  • Run experiments to study climate change, sea level rise and coastal adaptation impacts on flooding, waves, water quality and residence time

The two-year project brings together some of the best ocean and water quality modelers from the region, leveraging extensive experience with Jamaica Bay.  It will also include an educational research component and be carried out, in part, by a PhD student and a post-doctoral researcher.

References

DEP (2007), Jamaica Bay Watershed Protection Plan, Volume 1, New York, 128pp pp.

Franz, D. R. (1982), An historical perspective on mollusks in Lower New York Harbor, with emphasis on oysters, Ecological Stress and the New York Bight: Science and Management. Columbia SC: Estuarine Research Federation, 181-197.

Hartig, E. K., V. Gornitz, A. Kolker, F. Mushacke, and D. Fallon (2002), Anthropogenic and climate-change impacts on salt marshes of Jamaica Bay, New York City, Wetlands, 22(1), 71-89.

Leave a comment

Filed under ongoing projects

Collaborative Climate Adaptation Planning for Urban Coastal Flooding

PIs:  Philip Orton, Alan Blumberg, Peter Rowe (New Jersey Sea Grant Consortium), Tanya Marione-Stanton (Jersey City Department of City Planning); Partners:  Sergey Vinogradov, Naomi Hsu, Steve Eberbach, Jeff Wenger

Funding agency:  NOAA Sea Grant

Project period:  July 2013 – January 2015 (completed)

IMG_5013

Photograph of Philip Orton presenting at City Hall, at one of the public meetings where Jersey City Planners and Stevens Researchers presented options for reducing the chances of storm surge flooding.

Coastal cities across the country are weighing their options for adapting to rising floods, yet there is limited quantitative information available to help make these decisions. This project was a collaboration between coastal flooding scientists and Jersey City planners to develop and test several options for adapting the region’s urban coasts to flooding and sea level rise. Jersey City (JC) is the second-most populous city in NJ, yet has 43% of its land within the new FEMA 100-year flood zones. We leveraged pre-existing storm surge modeling and flood zone mapping to quantify the performance of a set of storm surge protection measures for Jersey City.

Outcomes and outputs from the research included: (1) regional flood zone maps that account for future sea level rise and storm climatology changes, (2) model-based map animations of how floodwaters enter JC to help understand how the pathways can be blocked, (3) a report of a collaboratively determined set of coastal adaptation options, and their performance with sea level rise, (4) an outreach workshop where we presented the project’s results to additional regional stakeholders, and (5) a transferable, peer reviewed and published adaptation planning and evaluation framework. Lastly, and still an ongoing process, it is our goal to help Jersey City, and possibly additional area cities, to implement climate change planning policies to adapt to coastal flooding.

This framework can also be utilized for many other U.S. coastal regions – anywhere that hydrodynamic models are already being used to simulate storm surges or map flood zones. FEMA has embarked on an ambitious effort to re-evaluate the nation’s coastal flood zone maps, and many of these regional efforts are utilizing these models. Many areas also have storm surge forecast models in place that can be similarly used for adaptation studies.

Project Results Summary

Computer storm surge simulations were used to map the effect of projected sea level rise on 100-year flood zones and to show the water pathways that flooded Jersey City during Hurricane Sandy, all useful information for planning measures that can prevent flooding.

Animation of modeled Hurricane Sandy flooding entering downtown Jersey City

Street-valley resolving animation of modeled Hurricane Sandy flooding entering downtown Jersey City (Blumberg et al. submitted). Color shading indicates floodwater depths over ground (legend on bottom right).

In several collaborative meetings, a broad set of realistic coastal protection measures and broad strategies were developed. Here is one example, a surge barrier that helps block a storm surge but could also be closed at low tide to create a rainwater basin for helping reduce the more frequent problem of rainfall flooding at high tide.

Illustration of one of 27 flood protection components, a surge barrier at the Tidewater Basin, south of downtown Jersey City

Illustration of one of 27 flood protection components, a surge barrier at Morris Canal Basin (aka Tidewater Basin), south of downtown Jersey City

This image comes from a partner project by Michael Baker Jr. Inc, and the report for that project is available here and includes both visualizations of the adaptation strategies, as well as a scoping study of what would be needed to conduct a benefit-cost analysis for the plans.

The storm surge modeling was then used to evaluate the efficacy of each adaptation measure, as well as how sea level rise and climate change will affect performance.  A city-wide adaptation scenario that combines several of the individual adaptation measures is found to protect most areas of the city from all storm events tested, ranging from a severe nor’easter that occurred in 1992, to Hurricane Sandy plus 31” of sea level rise (a high-end projection for 2055).

figure_SC4_success

Flood elevation model results for Hurricane Sandy Control (left), the full adaptation scenario (center), and the difference. In the right‐side panel, white areas have flooding in the control run, and do not have flooding with the adaptation scenario (flooding is prevented).

Hurricanes of a higher flood level than Sandy are possible, though unlikely – based on our replication of the FEMA flood mapping study (with added sea level rise), the 14-foot protection elevation could be overtopped by storms today, with an annual probability of 0.3%, or by storms after 31” of sea level rise, with an annual probability of 1%. A partial adaptation plan of land elevation increases around planned projects leads to prevention of flooding for most neighborhoods for the #2 and #3 largest flood events of the past century, the 1992 nor’easter and Hurricane Donna, but does not provide protection against Hurricane Sandy, and only keeps certain neighborhoods dry for the other flood events (e.g. Donna) when we consider 31” of sea level rise.

Read the full report here.

Leave a comment

Filed under ongoing projects